
As a housing service, we want to ensure we are accountable to tenants who live in our properties, and we are committed to being transparent about our performance.
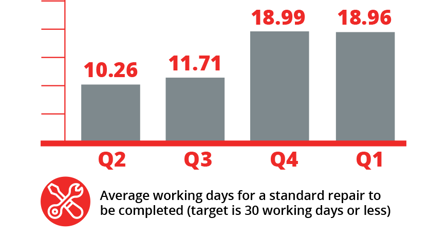
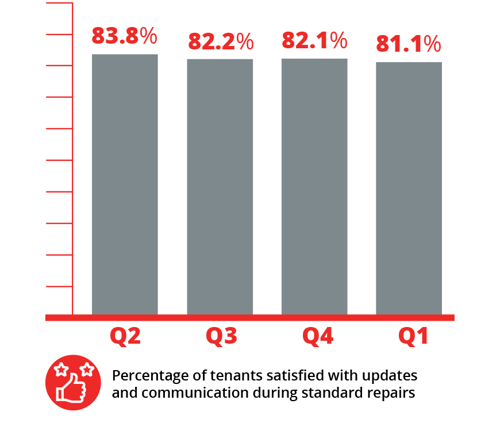
Our tenant-led performance group has carefully selected a suite of indicators to be reported each quarter (every 3 months). Some of the key indicators are displayed in the trend graphs below, which show changes over the past four quarters.
See the full suite of tenant-chosen performance indicators here.
For a more in-depth look into our performance, please view our more extensive suite of indicators. These are presented at the Housing Advisory Board meetings.
Legend:
- Quarter 2 - 1 July to 30 September 2025
- Quarter 3 - 1 October to 31 December 2025
- Quarter 4 - 1 January to 31 March 2026
- Quarter 1 - 1 April to 30 June 2026
You can see text-only versions of these graphs here, or click on an image to see the results for that indicator.
Repair completion times
Satisfaction with communication
Void properties
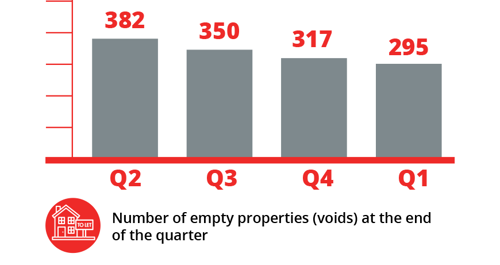
We are working hard to reduce the number of void properties. The number of void properties has been steadily reducing for the past year, and we expect to see further improvement throughout the year.
Evictions
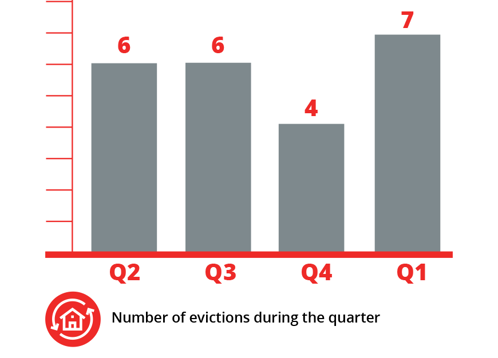
Eviction numbers are generally low and can vary from quarter to quarter. The majority of evictions are for non-payment of rent.
Housing Register
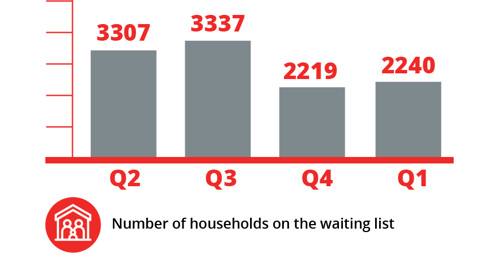
The fall in the number of households on the housing register in Q4 2025/26 was due to the introduction of a hibernation function, where applicants who have not been actively bidding for a long period of time are hibernated. The Housing Register numbers now reflect the number of actively bidding households.
Anti-social behaviour cases
Complaints performance
Want to know more?
Contact our tenant engagement team at tenantengagement@chesterfield.gov.uk for more details.